Using Elastic search is a great tool to analysze logs generated by your application
Elastic search is made up of 3 parts
- Elastic search –> the core search engine
- Logstah –> to parse the logs
- Kibana –> visualization
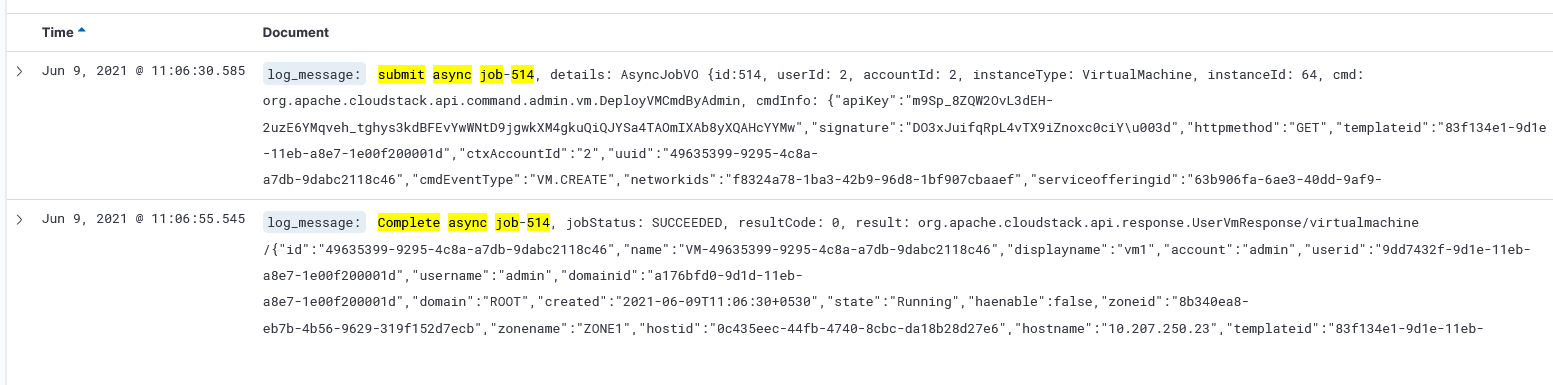
Here i have imported the cloudstack management server logs to the ELK and I can perform various analytics
- Follow the below link to set up your elk infrstructure
-
Once done make sure your elastic, logstash, and kibana process are able to communicate with each other
-
Get the logstash configuration from the following git hub repository
This git hub repo contains the logstash filtering for Cloudstack mangement server
https://github.com/kiranchavala/logstash-cloudstack
- Example
Make sure your the logstash.conf under /etc/logstash
The grok pattern folder is under /etc/logstash/pattern
Run the logstash binary
/usr/share/logstash/bin/logstash -f /etc/logstash/cloudstack.conf
The outputs the logs into the elastic search index and created various feilds
- Sample KQL query
To identify the total number of jobs of deployVirtualMachine
api_command.keyword : deployVirtualMachine and api_command_status : START
log_message : “submit async job-514” or log_message : “Complete async job-514”